Insights / Research / VOD share could rise to 50% of all viewing by 2029
Research / 3rd December 2020

Over the past few weeks, I found myself returning to my research days as I performed calculations on linear TV data in Excel sheets. I love watching chaos turn into order and the thrill of excitement as a pattern begins to emerge. Inspired by the statistical efforts of Downing Street and some top British universities throughout this crisis, I started tracking previous historical media ‘shifts’ and creating models to see where SVOD would take the world of entertainment. The results confirmed what most of us in the industry already suspected, the future is digital.
Netflix, the trail-blazer of SVOD, has earned the reputation of being a disruptor, an innovator, and a force for change. While it undeniably deserves this praise, the shift we are seeing is not disimilar to previous ‘media revolutions’ and thus, its trajectory may not be as hard to predict as we might think.
It is common to feel like modern events are singular, unprecedented, and wholly novel. This has been the case with the coronavirus pandemic as well as the powerful and influential rise of SVOD in the TV industry. However, just like current pandemic was predated by a global spread of the Spanish Flu, SVOD is simply the latest media revolution in a string of historical advances.
New technology has always affected the media landscape. Things like this have happened before. Historical records coupled with the wonders of big data allow us to predict, interpret and react to these events with evidence and data-driven decisions. In this blog, I hope to impart some of the conclusions I have reached.

Source: BARB (SVOD estimates produced by running umatched with games console viewing removed)
For those with busy schedules, I’ll cut to the chase. I created a model using Gompertz curves which fits closely with the actual registered data for linear and unmatched audience figures. As you can see in the chart above, linear viewing has dropped significantly from 2013 to 2019, while unmatched viewing has been increasing in tandem. The dotted lines show the upper and lower bounds of the estimates; this means that the best scenario for linear broadcasters would be that SVOD accounts for 40% of total viewing by 2030. The worst case scenario? It could account for half of all viewing.
The two ‘forecast’ lines on the graph are the estimates created by using the model of Gompertz curves. This model created two curved lines that, when adjusted for the effect of the lockdowns fit almost exactly to the actual results and their respective rate of climb and decline. This suggests that, unless any other force majeure interrupts the rate of growth for unmatched viewing, these predictions can be relied upon.
The model demonstrates how VOD penetration in the UK will reach an apex. The initial rapid growth will slow within the next five years and eventually reach a point of saturation. The same will happen with linear TV’s decreasing audiences.
A second point raised by the modelling is the astounding impact of the global pandemic and subsequent government restrictions on the rise of SVOD. The research demonstrates that the periods of lockdown accelerated the natural rate of VOD growth (and apposite linear decline) by one whole year. It’s worth mentioning that the pandemic also increased linear TV viewing, but we believe that this was principally driven by news consumption and have already seen the viewing levels fall as lockdown shifted.
This research is important for several reasons. Broadcasters need to be ready and prepared for the next media shift. They need to decide upon approach. Should they be trying to win back viewers or ‘viewer-time’ and fight to ‘flatten the curve’? Or should they adapt their businesses to focus more on their streaming platforms, contributing to and perhaps speeding up this shift?
There are no easy or simple answers to these questions, but, we can look back at similar historical media events to see how previous sectors were affected by changes in technology and viewer/consumer behaviour.
The story starts in the 40s and 50s, the cinema industry was booming. Until a new contender entered on stage: the TV set. As TVs became more widespread, the desire to view content was no longer solely the domain of the cinema. The large studios that produced content for the big screen began to change their tune. With time, as cinema admission dropped, more and more of them began investing a new kind of content. This was the birth of TV dramas.
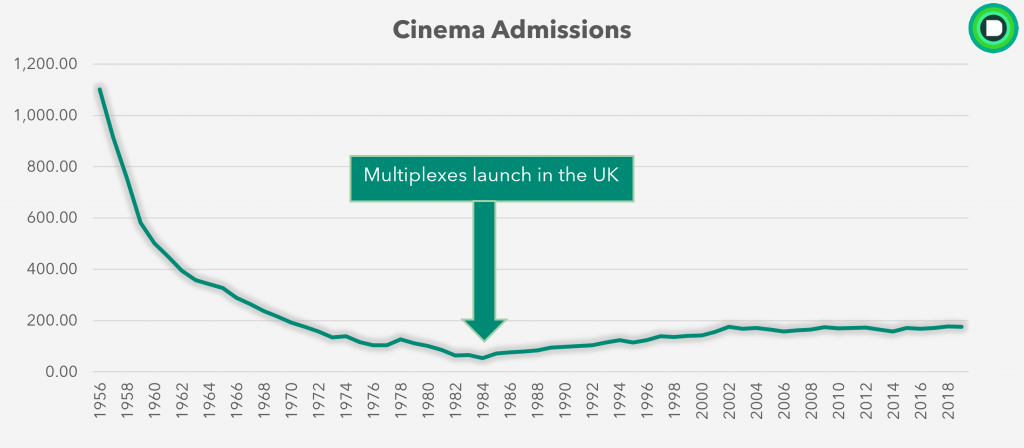
The dawning of the multiplex led to increases in cinema admissions and the opening of thousands of new cinema multiplexes around the country. Nevertheless, the TV set and the VCR (coupled with a myriad of companies renting out DVDs) meant that the cinema never returned to its former glory.
Looking at the way cinema admission went down when TV ownership increased can give us a good idea of what SVOD will do to linear TV.
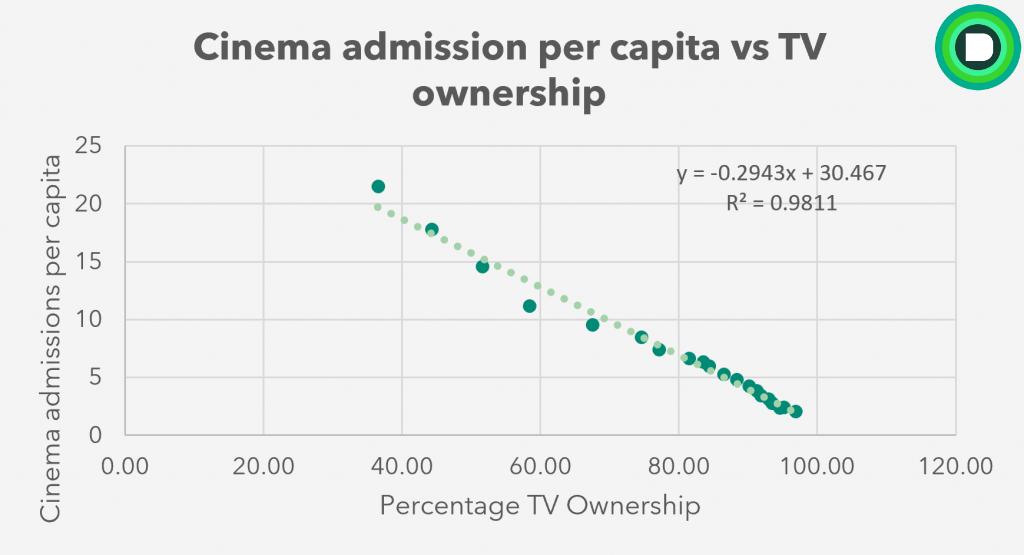
The above graph displays the correlation between TV ownership and cinema admissions per capita. The y equation implies that there is a strong negative correlation and the value of r² shows that 98% of the variations in cinema admission numbers were linked to the levels of TV ownership. Undoubtedly, TV took a large bite out of the entertainment cake, to the detriment of cinema.
The innovation of the TV set enabled people to satisfy a latent desire to be entertained by content but without having to leave their homes. What’s more, it was something new, a technological wonder, the latest media revolution. This drove cinema admission down from over 20 visits per year per capita in the 50s to less than 1 in 1985. At this point, the demand for cinema was unfulfilled due to limited number of films and screens. The multiplex met this need, but it only increased it to 2 admissions a week per capita.
Cinema will never win back a large amount of our ‘TV time’ or leisure time anymore. That much is clear. Turning on the TV is simply too easy. That said, high-quality films, good advertising campaigns and first-class services always attract footfall, even if they no longer hold market dominance. Cinemas adapted; multiplexes offered new forms of entertainment and new sources of revenue. What it couldn’t do was more of the same.

Finally, by presenting this same data in a different way (chart above), we can see clear resemblance to the forecast charts presented earlier in this article, the rate of cinema’s decline was very similar to the increased rate in TV ownership, and the same can be said of time spent viewing content on linear channels and SVOD services.

Alas, the dominance of TV was not set in stone. Or at least, the dominance of the terrestrial channels wasn’t. When there were only two channels in the UK, viewers only had the option of watching two programmes. The advent of the VCR and video rental companies added to the range of choice, but it was clumsy equipment, prone to breakages.
Video rental had its own pitfalls – you had to leave the house to rent out videos or DVDs and you also had to remember to return it or face large fines.
How to increase choice?
Increase the number of channels.
By 2010, there were over 300 channels on TV. Furthermore, the innovation of TiVo and PVRs allowed people to easily record and watch programmes when they wanted.
Once again, we see a pattern in media-shift. Convenience and choice. Terrestrial channels started to lose viewing from 2000 onwards, by 2012 total viewing was almost split evenly between terrestrial and multichannels. As more channels launched, the share of the five terrestrials declined and total multichannel viewing increased. How would the terrestrial channels react?
Well, they created their own multichannel offerings; E4, ITV2, BBC3. These innovations led them to claim back approximately half of the viewers they had previously lost. The result for the viewer? More choice, more flexibility and ease. This is linear TV as we know it.
With this new piece of research in my hand, I presented these ideas to my team. We decided to work together to make a new model. Using BARB data as well as Digital i’s proprietary SVOD viewing database, we developed an estimate of the proportion of the VOD market that broadcasters currently occupy. We did this through looking at time-shifted viewing and unmatched viewing on various devices as well as BARB’s VOD indicators (Sky only).
Our estimate is that broadcaster VOD currently holds a 20% share of VOD viewing via the TV set, with the other 80% taken up by SVOD services such as Netflix, Amazon and Disney+ as well as a number of smaller VOD services and YouTube.
Furthermore, we used our SVOD data to model the proportion of total VOD viewing that is taken up by Netflix. Our estimates suggest that 34% of all VOD viewing via the TV set is Netflix viewing, meaning that it holds a larger share than all BVOD services in the UK combined.
Of course, PVR is still playing a major part in the world of catch up viewing, we estimate that if you were to add recorded viewing into the mix, linear broadcasters’ share of all ‘non-live’ viewing would increase to 40%, with Netflix’s share decreasing to 25%.
However, as VOD becomes an increasing proportion of all viewing, traditional broadcasters will need to turn their focus to their streaming platforms to increase their share of this market. When total VOD viewing increases to 50% of all time spent on the TV and linear TV viewing continues to decrease, will 20% of that viewing be enough?
This journey through history serves to prepare the media industry for the next big change. We’ve focused on the UK as an example, but if you would like to see this research for another territory then let us know. In the coming months, I will expand this research to demonstrate what it means for broadcasters and content-makers across the globe.
SVOD is revolutionising the media industry and opened up the market for content of all languages across the world.
Digital i is in a privileged position of having access to Linear TV and SVOD viewing figures, we can see how Netflix is used across Europe. This means that we are perfectly positioned to advise broadcasters across Europe on their strategies of dealing with the competition posed by SVOD and declining linear audiences.
Get in touch if you would like to know more about SoDA, our online SVOD tracking platform and research tool and stay tuned for the next part of this research series, where we’ll show how SVOD has torn down country borders for content.
Speak to an expert to find out how our intelligence platform will revolutionise your TV reporting & SVOD research