Insights / Research / Netflix’s Mixed Bag: Usage Stats Ahead of Quarterly Earnings
Research / 18th April 2024

As the anticipation builds for Netflix’s quarterly earnings report, investors and analysts are closely examining the streaming giant’s performance across different regions. At Digital i, we’ve been tracking Netflix usage and content performance since 2019.
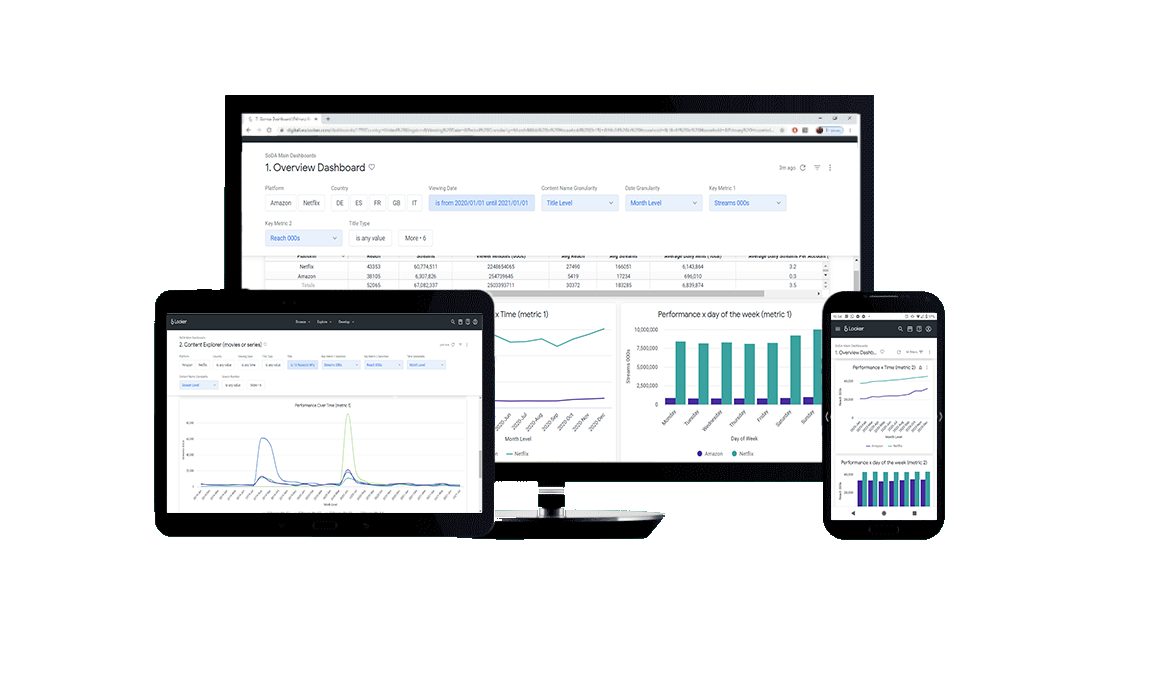
During that time, we’ve observed usage spikes preceding significant quarterly earnings announcements. We’ve also seen disappointing content performance ahead of missed financial expectations. So, what insights can we derive from SoDA (Digital i’s global, harmonised SVOD viewership analytics tool) about Netflix’s start to the year?
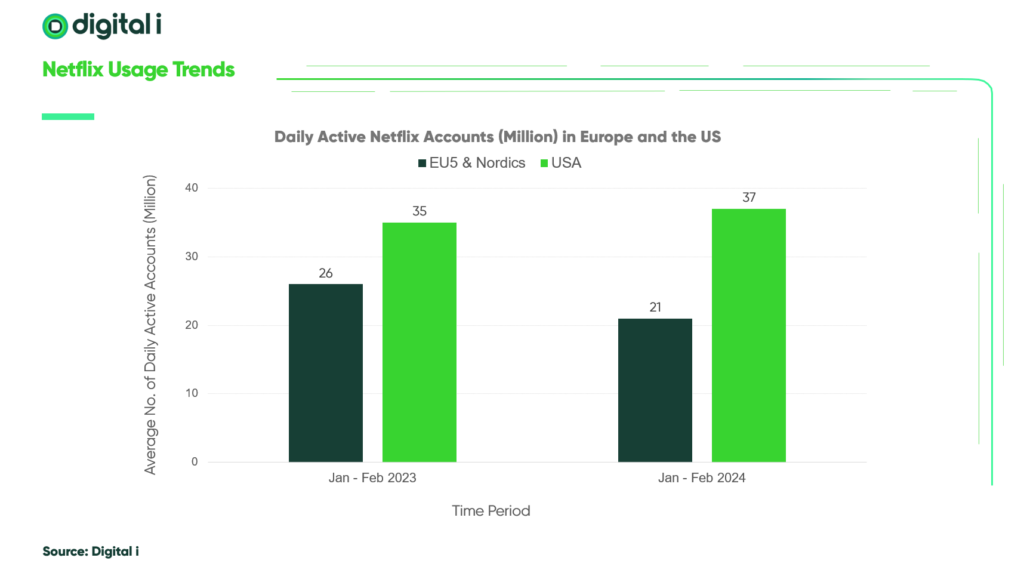
In terms of engagement, Netflix’s stats show an uptick across all parameters compared to last quarter. However, year-on-year usage paints a different picture entirely. While Netflix’s quarterly earnings announcement will provide high-level information about net subscriber growth and average revenue per member, it won’t reveal the number of loyal and established subscribers. That’s why we regularly examine the Average Reach metric to gauge platform health over time.
In the analysis below, we compare average daily reach year on year. In the USA, we observe a positive trend, with active daily accounts increasing from 35 million in January and February 2023 to 37 million over the same months in 2024. Conversely, in the five major European territories and the Nordics, we witness the opposite trend, with the number of active daily accounts dropping by 5 million since last year.
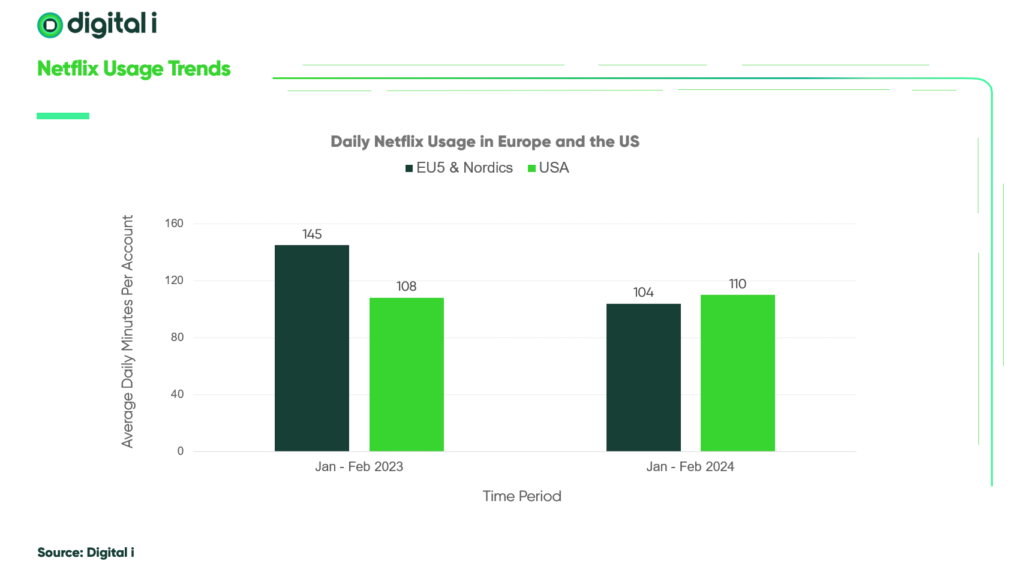
This trend persists when we analyse another key metric: Average Daily Minutes. Alongside active daily accounts, this metric is crucial for understanding levels of loyalty among a platform’s subscriber base.
Thanks to our harmonised global panels, and the strict quotas we apply to data collections, we can delve further. We can engage in complex cross-platform analyses to truly gauge viewer behaviour across all of the key streaming platforms.
In Europe, global competitors still have a long way to go to reach similar levels of engagement. However, activity has increased on Disney+ and Prime Video and HBO Max have maintained steady levels of user activity.
Looking ahead, Netflix faces a balancing act. It seeks to sustain its momentum in established markets while reigniting growth in regions experiencing headwinds. As competition intensifies, adaptability and innovation will be key to Netflix’s long-term success.
In conclusion, Netflix’s performance ahead of its quarterly earnings reflects a tale of two continents: soaring heights in the US and choppy waters in Europe. While challenges persist, Netflix remains a dominant player in the global entertainment industry.
For more information about the metrics we used in this analysis, please get in touch.
Speak to an expert to find out how our intelligence platform will revolutionise your TV reporting & SVOD research